Características del Producto
| Peso | 6 kg |
|---|---|
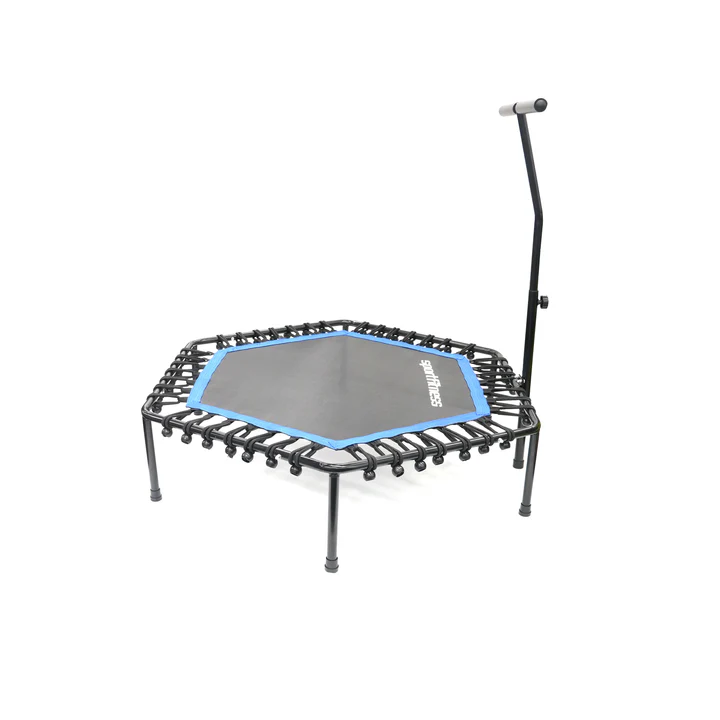
| Dimensiones | 116 × 127 × 112 cm |


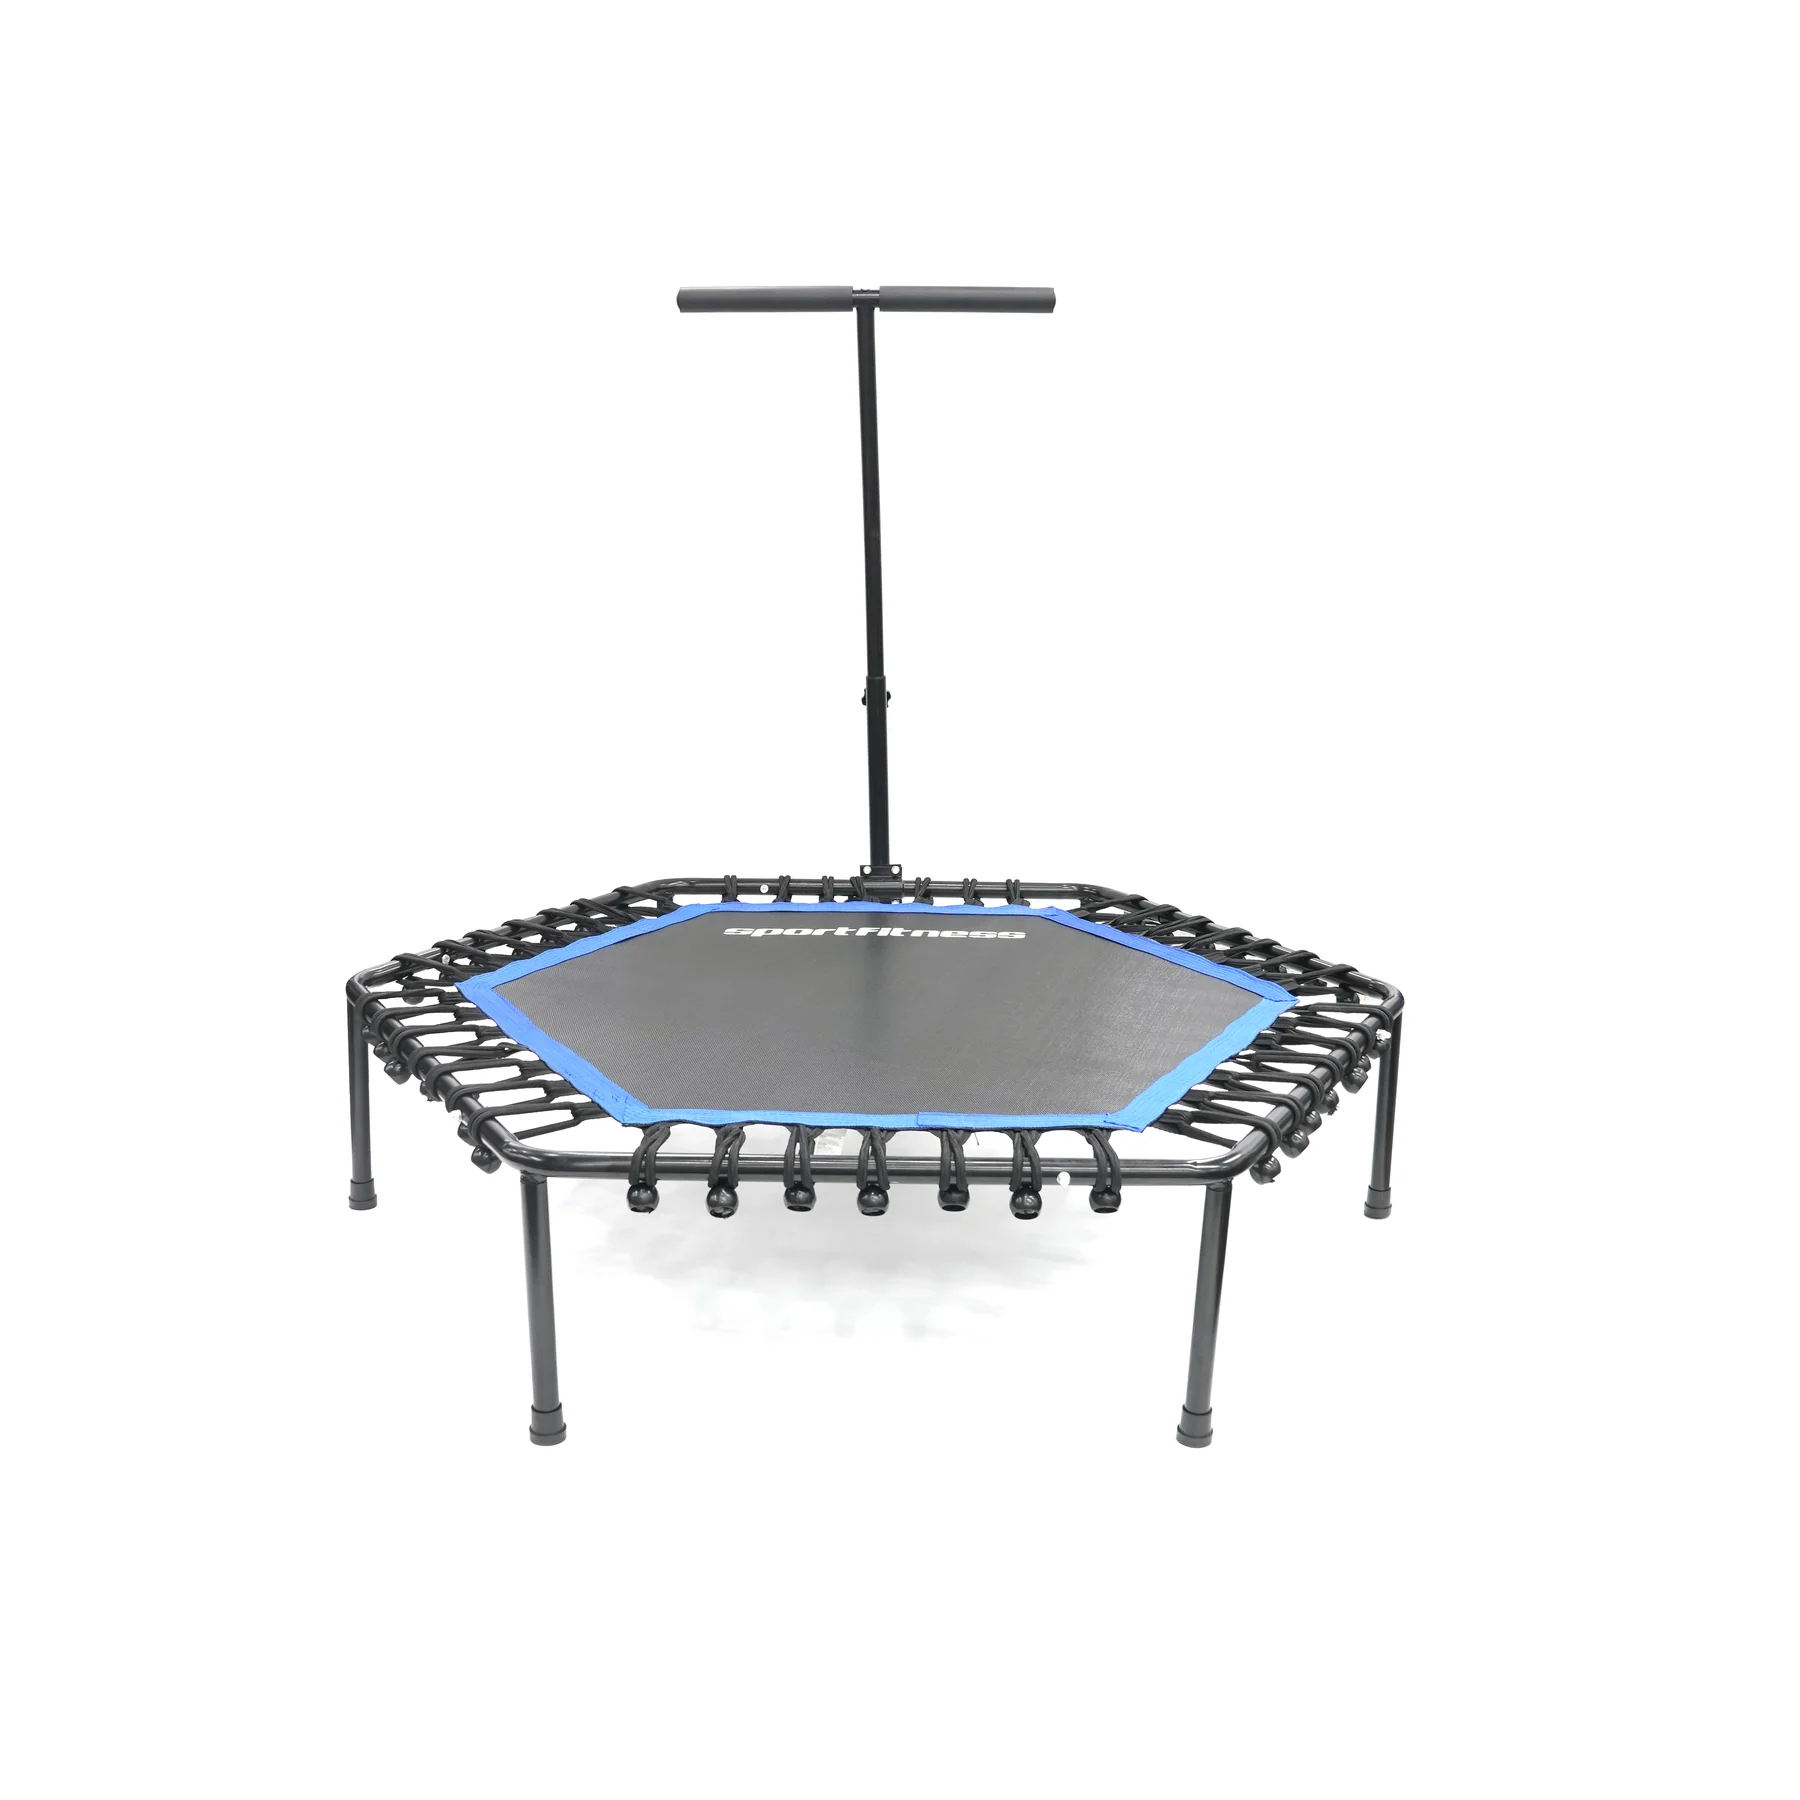
Original price was: $462.664.$370.131Current price is: $370.131. IVA
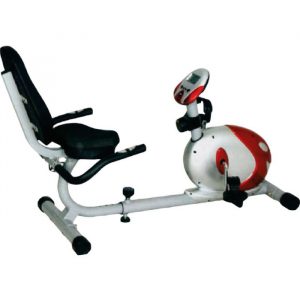
Su diseño con barra de agarre ajustable brinda estabilidad y seguridad, ideal para entrenamientos de bajo impacto que tonifican y fortalecen todo el cuerpo. Perfecto para quemar calorías y mejorar el equilibrio desde casa.


| Peso | 6 kg |
|---|---|
| Dimensiones | 116 × 127 × 112 cm |
Debes acceder para publicar una reseña.

Calificación
No hay Calificación aún.